Study on Ventilation and Cooling Optimization of Air Pressure Station in Textile Mills
2024-03-14
Air compressors can affect the productivity and quality of textile mill products in many ways. For most textile companies, the process of producing compressed air consumes a lot of energy, accounting for more than 30% of the textile industry's energy consumption, and generally there are multiple air compressors in the air pressure station, whose operation generates a lot of heat. Although most of the heat is taken away by the cooling water, the remaining heat dissipation is still high, causing temperatures to rise in the vicinity of the air compressor, thus worsening the unit's operating conditions.
The indoor temperature of the air pressure station is especially important for the work of the air compressor, so how to solve the heat dissipation problem of the air pressure station is extremely critical. In recent years, many scholars have done a lot of research on the problem of ventilation and heat dissipation within the working environment. A researcher used the CFD W method to numerically simulate the original ventilation scheme of the air pressure station. Based on the original ventilation scheme, we explored three improvement schemes, namely changing the position of the air inlet, the position of the air outlet and the area of the air pressure station, and came up with an optimized design scheme for the ventilation and heat dissipation of the air pressure station. Another researcher numerically simulated the air compressor room model of another power plant by using the CFD method to analyze the effects of different air supply angles and speeds on the cooling effect of the air compressor, and concluded the best optimization decision for the air compressor room.
Our company through a textile factory field research, found that the existing air supply program can not be effective cooling of the air compressor unit cooling. For this reason, we have tested the current temperature and wind speed distribution in the air pressure station during the summer months, using CFD numerical simulation as an aid. Use theoretical calculations to obtain the maximum air volume required for the air supply of the air pressure station, and determine the air supply speed of each outlet. Then use CFD to analyze the velocity field and temperature field under the maximum air volume. On this basis, a comparative analysis was carried out to deeply optimize the ventilation and cooling system of this air pressure station.
1. A Field Study of Textile Mills' Air Pressure Stations
1.1 Overview of the Air Pressure Station
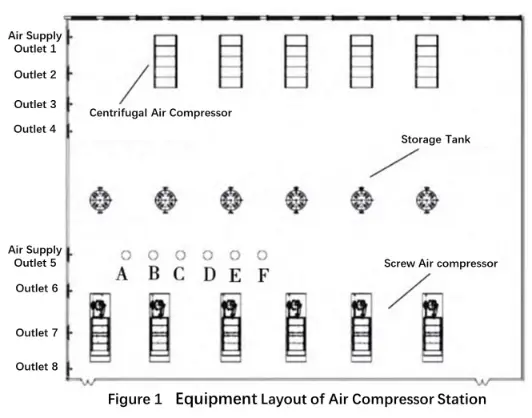
In the study, the air compressor station of a textile factory was used as the study site, which covers an area of 2016 ㎡ with a height of 7 m. There are five centrifugal air compressors and six PM VSD screw air compressors in the air compressor station. They uniformly produce compressed air to meet the air demand of the three branches of this textile factory. In summer, in order to ensure the normal operation of the equipment and solve the problem of high ambient temperature in the air pressure station, the station adopts a combined air conditioning unit, which filters and cools the outdoor fresh air, and then sends the low-temperature air to the air supply outlet on the side wall of the station through the air ducts, and then sends the air into the station in the form of side air supply to cool down the temperature. The arrangement of the air pressure station is shown in Figure 1.
1.2 Measurement Analysis
Test the air supply volume, air velocity, temperature, relative humidity and other parameters of the ventilation system of the air pressure station, and it was measured that the temperature near the suction port of the air compressor at the height of 2m was 41.7℃, and it was found that the indoor temperature was relatively high. We believe that the original ventilation program of the textile factory, which was treated by the combined air-conditioning unit, could not effectively cool down the air compressor unit.
In order to investigate the cooling effect of the air supply scheme of the air compressor station, we set up measurement points at the cross section of 6.1m height in the air compressor plant, test and record the data by using temperature & humidity measuring instrument and impeller anemometer. The air velocity of air supply outlet 1 to air supply outlet 8 of the air pressure station is measured respectively as 7.5 m/s, 7.8 m/s, 7.8 m/s, 7.9 m/s, 8.0 m/s, 8.0 m/s, 8.2 m/s, and 8.3 m/s, and the size of each air supply outlet is 1.5 m×0.6 m. The total air flow of the air pressure station can be calculated as (7.5+7.8+7.8+7.9+8.0+8.0+8.0+8.2+8.3) × 1.5×0.6= 57.15 (m3/s) = 205740 (m3/h).
In order to analyze the actual application effect of the air supply cooling system in the air compressor station, we arranged 6 measurement points in the air compressor room (as shown in Figure 1), and the A measurement point is 6 m away from the west wall. A, B, C, D, E, and F measurement points are separated by 3 m, and their temperatures are uniformly distributed with little change, and the test results of each measurement point are shown in Table 1.
| Table 1 Measurements of Wind Speed and Temperature and Humidity in the Air Pressure Station (Z=6.1m) | |||
| Measurement Points | Wind Speed (m/s) | Temperature (℃) | Relative Humidity (%) |
| A | 3 | 35.7 | 49.3 |
| B | 2.4 | 35.8 | 48.3 |
| C | 1.5 | 35.8 | 45.1 |
| D | 0.9 | 36.2 | 44.8 |
| E | 0.5 | 36.8 | 44 |
| F | 0 | 37.8 | 43.1 |
2. Modeling and Simulation Analysis: Air Pressure Station
2. 1 Mathematical Model
Our company uses a three-dimensional, unsteady mathematical model to analyze and calculate the fluid in the air pressure station, where the air flow is in the form of turbulence. In this model of ventilation and heat dissipation, the air flow satisfies the continuity equation, momentum equation, and energy equation, and a standard model is established for calculation. Finally, we set the convergence rule, initialize it, set the number of iteration steps and perform calculations until convergence is reached. According to different operating conditions, simulations are performed to analyze the velocity field and temperature field in the air pressure station.
2.2 Geometric Modeling and Meshing
The geometric model was established according to the building dimensions, and the simulation study of ventilation values inside the air pressure station was carried out according to the geometric model. Figure 2 shows the axonometric diagram of the geometric model, in which X is the length direction (-25. 2 m to 25.2 m), Y is the width direction (-20 m to 20 m), and Z is the height direction (from 0 m to 7 m). There are 8 square air supply openings (0.6 m×1.5 m) at the west wall, 6 round exhaust (0.55 m in diameter) at the north wall, 5 centrifugal air compressors against the north wall, 6 storage tanks in the center, and 6 screw air compressors against the south side.
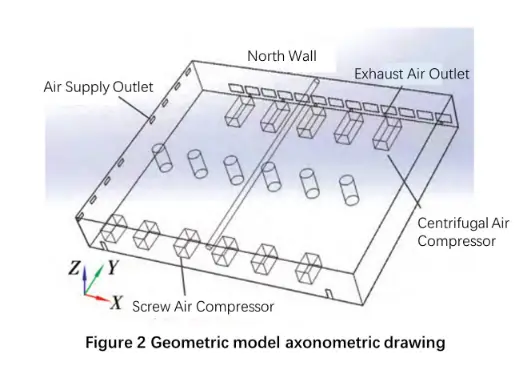
When performing meshing, due to the complexity of the internal structure of this model, so we simplify some of the structures that have less influence on the flow field, thus reducing the difficulty of structured meshing. Therefore, we choose a structured mesh with high mesh quality and fast convergence speed, and the maximum mesh size in the model is set to 200mm, with a final mesh node count of 6186819 and a total mesh count of 6053244.
2.3 Validation Analysis of Simulation Results
According to the arrangement of the air compressor units in the air compressor station, we selected suitable cross sections and analyzed the velocity and temperature fields in the room, which were used to verify the feasibility and reliability of the established model. Table 2 shows the comparison between the measured wind speed and simulated wind speed on site, and Table 3 shows the comparison between the measured temperature and simulated temperature on site. It can be seen that the difference between the measured wind speed and the simulated wind speed is not large, the maximum error is 0.5 m/s, the maximum error between the measured temperature and the simulated temperature is 1.3 ℃, and the error is controlled within the permissible range, so the established model is feasible and reliable.
| Table 2 Table of Comparison of Velocity Field Unit: m/s | |||
| Measurement Points | Measured Wind Speed | Simulated Wind Speed | Absolute Error |
| A | 3 | 3.3 | 0.3 |
| B | 2.4 | 2.8 | 0.4 |
| C | 1.5 | 2 | 0.5 |
| D | 0.9 | 1.3 | 0.4 |
| E | 0.5 | 0.9 | 0.4 |
| F | 0 | 0 | 0 |
| Table 3 Table of Comparison of Temperature Field Unit: ℃ | |||
| Measurement Points | Measured Temperature | Simulated Temperature | Absolute Error |
| A | 35.7 | 34.6 | 1.1 |
| B | 35.8 | 34.8 | 1 |
| C | 35.8 | 34.9 | 0.9 |
| D | 36.2 | 35.1 | 1.1 |
| E | 36.8 | 35.9 | 0.9 |
| F | 37.8 | 36.5 | 1.3 |
3. Calculation Analysis
3.1 Theoretical Calculation of Air Supply Volume of the Air Pressure Station in Textile Mills
The heat inside the air compressor room basically comes from the air compressor. Since there are not too many operators inside the air compressor room, and the operating time of the machine is not long, so the influence of heat and humidity load generated by the personnel can be ignored when calculating the air supply volume. There are 5 centrifugal air compressors and 6 screw air compressors in this room. However, during the normal operation of the air pressure station in summer, the six screw air compressors are often shut down, so we only consider the heat dissipation of the five centrifugal air compressors. The main parameters of the centrifugal air compressor: power 1430kW, compressor shaft power 972.4kW, total compressor power 1215.5kW.
- (1)According to the formula Q1=KF(tZp- tnx), Q2=CwKwFw(TWl+td-tnx) it can be derived from the cold load Q1 formed by heat transfer from the external wall and roof, and Q2 formed by heat transfer from the window. Considering that for air-conditioned areas such as air pressure stations, where the permissible range of room temperature fluctuation is not less than ±1.0°C, the calculation can be approximated according to steady state heat transfer. Where,tap is the summer air-conditioning outdoor calculation of the average daily integrated temperature, taken 30.7 ℃. The calculation gives Qsurround = Q1+Q2=13.5 (kW).
- (2) According to the formula heat flow Q3 = number of units × 94% × compressor shaft power + (compressor total power - compressor shaft power) can be derived from the indoor heat source caused by the cold load. Q3 = 5 × 0.94 × 972.4 + (1,215.5-972.4) = 5786 (kW). For centrifugal water-cooled air compressor unit in the air pressure station, the cooling water takes away most of the heat generated by compression (about 90%), only 10% of the heat is still left in the room, and a total of five centrifugal air compressors in the air pressure station, can be obtained from Qair pressure = 10%×Q3 = 578.6 (kW). Then Qtotal = Qround + Qair pressure = 13.5 + 578.6 = 592.1 (kW).
- (3) Calculate the volume of air supply. It is known that the air pressure station has eight air supply outlets, the size of which is 1.5 m × 0.6 m, the temperature of the air is 23 ℃, the relative humidity is 90%. For the air pressure station, the requirements for indoor temperature and humidity are not strict, and you can choose a larger air supply temperature difference. Take the difference of air supply temperature Δt=9℃, indoor is 32℃, relative humidity is 50%. On the enthalpy-humidity diagram, we can find the indoor enthalpy hn = 70.49 kJ/kg, the enthalpy of the air supply outlet ho = 63.64 kJ/kg, and the volume of the air supply q = qtotal/(hn - ho ) = 592.1/(70.49-63.64 ) = 86.44 (kg/s). The air density is taken as ρ=1.2 kg/m³, then the volume flow rate of the air supply is 86.44/1.2×3600=259320(m³/h), and the velocity of the air supply from the air outlet is 86.44/(1.2×1.5×0.6×8)=10(m/s).
3.2 CFD Simulation Analysis
From the theoretical required air volume calculated earlier, the maximum air velocity of the air supply outlet can be derived as a boundary condition, and the windows and doors are taken as free outflow; the ground is taken as an adiabatic surface; and the roof and external walls are taken as a constant temperature. Considering that the position of the air supply outlet is too high, the airflow sinks very slowly in the process of air being sent to the room, and the cold air cannot reach the position closer to the suction port of the unit, so the air supply outlet is adjusted downward by 1m appropriately.
4. System Optimization Study
4.1 Comparison Analysis Before and After Optimization
From the previous section, it can be concluded that the theoretically required air supply volume of the station is 259320 m³/h, which is larger than the actual air supply volume of the station, which is 205740 m³/h. According to the arrangement of the compressor units in the station, we selected a suitable cross-section and analyzed the indoor velocity field and temperature field.
Compare the velocity fields before and after optimization. Due to the difference in the air supply volume and the influence of the air supply height, the theoretical air supply has a relatively long distance, which can basically cover the whole air pressure station. In the actual air supply process, the air supply distance is short and the cold air cannot reach the latter compressor units.
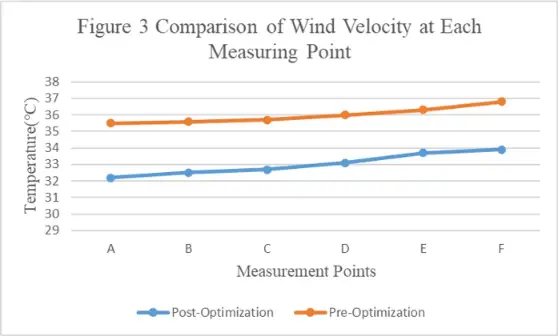
The temperature of each measurement point before and after optimization is compared, as shown in Figure 3. It can be seen that the temperature of each measurement point after optimization is significantly reduced compared to the temperature before optimization. After calculation, the temperature non-uniformity coefficient before optimization is 0.574, and the temperature non-uniformity coefficient after optimization is 0.677, which is better after optimization, indicating that this optimization can provide a better ventilation and cooling for the textile factory air compressor station.
4.2 Exploration of Energy Saving Operation
Because the use of air conditioning is too energy-consuming, the enterprise will only take this measure in the particularly hot summer, so we intend to use the combined air-conditioning room in the summer to cool down the air compressor station, in the winter and the transition season we will introduce outdoor fresh air to the air compressor station to ventilate and cool down the air compressor station to achieve the effect of lowering the overall temperature of the workshop, and to provide a certain reference value for the energy-saving renovation of textile enterprises' air compressor system. The technical programs adopted above are shown in Figure 4 and Figure 5.
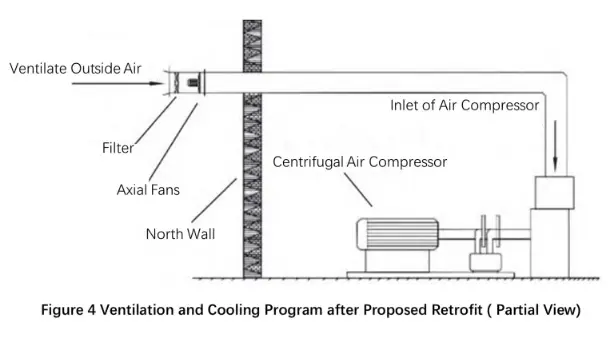
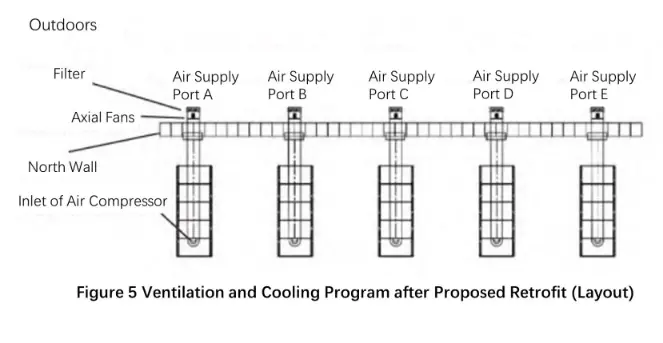
The specific optimization plan is to carry out ventilation at the north wall, by connecting air ducts to the suction inlet of the air compressor unit through the windows on the north side. This method can renovate the ventilation and air conditioning system of the existing air compressor station, so that its airflow organization can be more rationalized and the environment of the station can be optimized to the greatest extent.
5. Conclusion
In order to improve the problem that the temperature in the air pressure station of a textile factory is too high and unevenly distributed, and that the existing ventilation system cannot effectively cool down the air compressor unit, our company tested the temperature and air velocity distribution in the air pressure station in summer, and simulated the air pressure station with the help of CFD using actual measured data. On this basis, use theoretical calculations to derive the maximum air volume required for the air supply of the air pressure station, and then determine the air supply velocity of each outlet; use CFD to analyze the temperature field and velocity field under the maximum air volume, the following conclusions can be drawn.
- (1) In the actual air supply process, the textile factory air compressor room inside the air supply is not enough, you can increase the total air supply or local optimization of the system design, and connect the ducts at the side air supply outlet, directly to the heat dissipation of the air compressor group for local air supply.
- (2) In the actual process of air supply, the temperature inside the air compressor station is high, and the effective cooling of the air compressor unit can be realized by reducing the temperature of the air supply outlet and increasing the air supply speed.
- (3) In the actual air supply process, the method of side air supply cooling used in most air pressure stations does not effectively reduce the temperature inside the station. If the air supply outlet position is high, it will lead to the cold air can't reach the position closer to the suction port of the unit, so we can improve it by reducing the height position of the air supply outlet.
- (4) Considering the energy saving issue, we can cool down the air pressure station by opening the combined air-conditioning room in summer, and ventilate and cool down the air pressure station by bringing in fresh air from outside in winter and transitional seasons.
Check new blog here.


